We are looking at your money. Of course, with the chockfull of posts we have already posted on the subject of making and saving money. The inspiration comes from the web, which seems to have a bountiful of resources on creating wealth. Investing right is a lot about timeliness. That’s where the right information bolstered by real-time data is the need of the second. The good websites on investment advice go beyond ticker tapes. When you have so many websites to pick from, how do you decide on the best online investing website?
Well, you try them out and pick the one that works for you. Most of these websites have portfolio tools that help you manage your investments online.
So, here are
SIX more to sift through for some of the best online investing websites with aids and tips
FIN VIZ
This site is another stock visualization tool. The stock screen er also works with various filters and you can even create your own custom screeners and map it to the online portfolio for the stocks you want to focus on. You can save them as presets and use them later too. The web app supports multiple charts with which you can monitor aspects like different sectors, futures and Forex markets, or high performing stocks easily (among other things-almost all of the features that can be seen on the main site are available for free, with delayed data. Analysis tools are quickly accessible to all users by clicking on the corresponding button on the main menu of the site.
 |
| Figure 1: Main Menu |
News: The news feed is a list of the latest news from sources such as
Bloomberg, CNN and many others as well as from financial blogs. The news feed can be sorted by time or source.
Screen er: The screen er is an advanced tool, which allows visitors to filter stocks by multiple descriptive,
fundamental and technical indicators, and then sort the data by a large number of criteria. The screen er is available to all users, although to save a screen requires registration (free).
 |
| Figure 2: Screener |
Narrow the search for the right stock by inputting descriptive criteria such as the exchange, market capitalization, or price or average volume to name a few. Choose from fundamental criteria including P/E ratio,
debt/equity ratio, net profit margin or EPS growth among others. Select technical criteria to further narrow the search using filters such as performance, chart patterns, candlesticks or RSI levels. All together there are over 60 criteria, which can be customized to different values providing thousands of ways to fine-tune the stock screener.
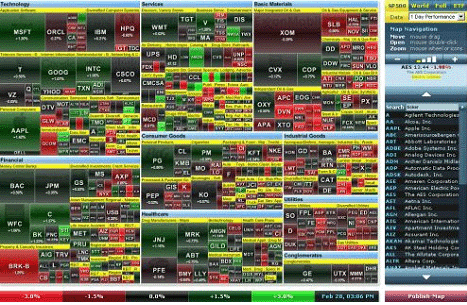
Maps: The map function provides a quick way to see which stocks are moving, in which direction and at what magnitude. The map can show the S&P 500, world stocks or
ETFs in a variety of ways and on multiple time frames. Everything is color coded to easily spot outperforming or underperforming stocks.
 |
| Figure 5: S&P 500 Map (1 Day Performance) |
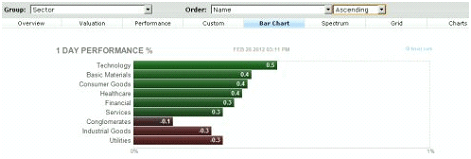
Groups (Sectors): The groups tab provides a snapshot of how sectors have been performing over a number of time frames. Stocks can also be sorted by performance in terms of industry, country or capitalization. How the data is viewed can also be altered from bar chart form to overview, valuation, performance, spectrum, grid or charts.
 |
| Figure 6: Sector Performance in Bar Chart Form |
Insider: The insider feature shows recent insider transactions including the value, whether it was a buy or sell, the number of shares and who made the transaction. The information can be sorted and filtered in a number of ways.
Futures: The
Futures tab allows traders to get a quick snapshot of what is happening in the Futures market, including which contracts are up or down and by how much. Everything is color coded for easy visualization. A relative performance chart is also included so visitors can quickly see which contracts are outperforming or under performing.
The data is viewable in quote form as well as in chart form. Chart form shows the individual charts of the Futures in small windows side by side for easy comparison.
 |
| Figure 7: Futures in Quote Form |
Forex: Very similar to the Futures tab, the Forex tab provides a quick snapshot of what the major currencies are doing. A relative performance chart is also shown to visualize which currency pairs are outperforming or underperforming. The data can be viewed in chart form or
quote form.
Guru Focus

GuruFocus.com tracks the stocks picks and portfolio holdings of the
world's best investors. This value investing site offers stock screeners
and valuation tools. And publishes daily articles tracking the latest
moves of the world’s best investors. GuruFocus also provides promising
stock ideas in 3 monthly newsletters sent to Premium Members
Learning how the best investors invest can fast track you and your
investment pile. The site doesn’t have a direct portfolio management
tool but it’s job is to guide you to pick the right stocks. The site
serves investment ideas through financial news, insights, and
commentaries. The site is not about short term investing. The Real Time Guru Picks is a membership based feature but most parts of the website are free.
STOCK MAPPER
StockMapper
[stockmapper.com] (note: works only during U.S. markets are open...) is
an online stock heat map, representing the performance of all common
stocks listed on the NYSE Euronext. The heat map renders the individual
percent changes in market value for more than 1,800 U.S. and non-U.S.
stocks. Users can filter the stock quotes by logical groupings such as
geographic region, industry and major indices. The map can also be
sorted by ticker symbol, price change, volume or market capitalization.
Upon selecting an individual stock group a "bridge bar chart" appears of
the price change and trading volume of all stocks in the group.
Interestingly, StockMapper was originally designed as a
non-interactive map of the market to be shown on a number of exterior
data displays outside of the NYSE's Wall Street building.
Stock heat maps are visual aids which constantly update and tell you
what’s going up and what’s down in the financial markets. StockMapper is
a collection of many such heat maps which reflect the volatility of
today’s financial markets. The stock heat maps cover some of the major
exchanges like NASDAQ, NYSE, and Eurotrac. You can use the heat maps as a
‘dashboard’ and apply filters to get the information you want according
to all the relevant indices (there’s a 3-D map too). Clicking on the
color coded stock points also brings up news feeds related to that
particular stock or company.
MARKET WATCH
MarketWatch operates a financial information website that provides business news, analysis, and
stock market data. The company operates
BigCharts.com and the stock market simulation site
VirtualStockExchange.com. MarketWatch
provides radio updates every 30 minutes on the MarketWatch.com Radio
Network. It also offers subscription products for individual investors,
including the Hulbert Financial Digest suite of products, Retirement
Weekly and ETF Trader.
MarketWatch is a subsidiary of
Dow Jones, a property of
News Corp.
MarketWatch is part of Dow Jones' Consumer Media Group, along with
The Wall Street Journal, Barron's, the
WSJ.com and affiliated internet properties.
Anything from Wall Street Journal is a must read if you want to invest
wisely. Apart from the topics, companies, people, investment aids, and
markets in the news, do take a look at the
podcasts and the
Virtual Stock Exchange Game.
The section on investments has a range of tools that could help to make
your decisions more carefully planned out. For instance, the list of
top IPO performers (and worst too), mutual fund comparisons, and the
other screening tools are worth a bookmark. The My Portfolio section is
lets you track your investments.
FINANCIAL TIME
The
Financial Times
is ditching the metered access model it pioneered and switching to an
approach that will require users to pay to access most of the
newspaper’s content online.
Currently, readers can access up to three articles a month if they are registered, but must become subscribers to access any more.
Starting on Friday, the newspaper, which is owned by the Pearson
Group, will begin rolling out a system where visitors are offered a
month’s trial providing access to most FT content for a “nominal” sum.
The FT says it is still working on the details of the new system, but
initially those already registered will still be able to access three
articles a month.
FT CEO John Ridding
said: “Eight years ago we launched the metered model, which has been
fantastically successful. It’s been a real source of transformation and a
good source of contribution to the business. We are evolving this and
developing a different approach which is paid-for trials, whereby as for
a nominal sum, will have unlimited access for a month.
“The theory is that within that they can build a habit, and then become a subscriber.”This top-notch publication needs no introduction. For worldwide coverage
of the latest financial trends, this publication is the one to read.
But then it also covers regional markets like Asia, the Middle East, and
India just as well. Don’t forget to check out the lineup of tools (as
in the screenshot) or the many blogs that are on the second tier of the
website.
YAHOO FINANCE
Your #1 finance destination to track the markets and the economy.
Follow
the stocks you care about most and get personalized news and alerts.
Access real-time stock information and investment updates to stay on top
of the market.
Track the performance of your personal portfolio.NEW:
Create unlimited watchlists and add/edit holdings from your mobile device. (Signed-in users only)
Favorite features:
- Add stocks to watchlists to get real-time stock quotes and personalized news
- Find all the financial information you need with sleek, intuitive navigation
- Go beyond stocks and track currencies, bonds, commodities, equities, world indices, futures, and more
- Compare stocks with interactive full screen charts
- Sign in to view and edit your Web portfolio on the go
Yahoo Finance along with Wikinvest finds a place on 107 Best Websites on The Web
list. Along with financial headlines, you get you get free stock
quotes, portfolio management resources, international market data,
message boards, and mortgage rates. Also, Yahoo Finance is localized
just like its main portal for some major countries around the world.
Some new features to look at include the streaming codes, smart lookup
for to find quotes faster, a new personal finance section, and more.
Then of course, there’s the Experts panel and Money Guides among the
tools.
These sites and their investment tools are for the serious investor.
You would need a fair degree of know-how to tackle the data that’s
thrown out. Reading our other wealth related articles could lay the
groundwork. Here are some of them:


1 comments:
Write commentscafebabel
Replysasname
onfeetnation
recordsetter
kaskus
flicks
soundcloud
iin-qadrie
careerbliss
hackathon
EmoticonEmoticon